Signs of economic recovery
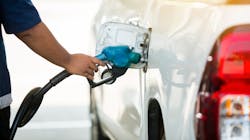
Among the most frequently asked questions related to the economy is, “Where can I look for news about how the recovery from the pandemic is going?” The answer, which might surprise you, is right out the windshield of your car as you pass a gasoline station. Why? Because the price of gasoline is one of the best coincident indicators of the level and trend of economic activity. If you take the price per gallon you paid the last time you filled up your tank, and the last price per gallon you saw on your way to work today and compare the two, you will have a pretty good start on figuring out what has been going on.
If you look at a chart of the price of gasoline and a chart of the volume of gasoline consumed, you will see they look quite similar. Except in the periods associated with crude oil supply problems, the pump price of gasoline moves in the same direction as consumption. That’s why the average pump price the week of March 2 (just as the pandemic was getting underway) of $2.514 per gallon fell to $1.870 per gallon by the week of April 27 when just about all of the country was on lockdown.
We all drove less between March and May, so we used less gasoline – a lot less gasoline. Consumption was running at 9.5 million barrels per day in March. As some of us went back to work between May and September, we drove more, so gasoline consumption rose from 5.5 million barrels in May to just under 9 million barrels per day in September. Prices mirrored that pattern. We are currently still using less gasoline today than we were a year ago, so the price is less.
As we write this in early September, the average price of gasoline was $2.302 per gallon. That is more than 12 percent below the $2.638 per gallon of September 2019.
Over the next several months, the relationship between price and usage should continue to hold. We say “should” because one of the quickest ways to have your head handed to you as a forecaster is to use the word “will” when you are talking about the crude oil and refined products markets.
Along with what gasoline prices tell us about the level and trend of current economic activity, they also have some important information about the headline rate of inflation you will read about in the next several reports of the Consumer Price Index.
As of July, the headline rate of inflation, which is the year-over-year percent change in the All-items Consumer Price Index, was 1 percent. However, if you remove the energy components of the index, of which gasoline prices are the largest part, the rate of inflation increases to 1.9 percent. That difference is accounted for by the fact that gasoline prices in July were 20.3 percent below where they were a year earlier. Over the next several months, we can expect to see the headline inflation rate rise, in part because of what we have already seen with gasoline prices.
While none of us likes to pay more for gasoline, you might want to keep in mind that the current increase in price is actually good news, because it is a sign of increased usage. This means we are working our way back to the conditions of early March, and I, for one, have no problem with paying another 20 cents per gallon to help get us there.
About the Author

Robert Dieli
Economist at MacKay & Company
MacKay & Company specializes in market research for commercial trucking, construction equipment, and agricultural machinery. The company provides strategic research and analysis to vehicle and component manufacturers, distribution and service channels, industry associations, and private equity firms. With a long career managing portfolios and coordinating domestic economic forecasting programs, Dieli began RDLB, Inc. in 2001. In this role, Dieli serves as an advisor to many firms in the trucking, consulting, and financial services sectors. He is also an economist with MacKay & Company.
