Recommended Practice 551: Root Cause Analysis (RCA) was introduced at the American Trucking Associations’ 2023 Technology & Maintenance Council Annual Meeting, and after much study and debate, it is tentatively slated for publication in the 2025 manual. It was championed as a formal way to troubleshoot using the scientific method and logic. After using it on a real job, I found it may be one of my most essential tools as a diagnostic technician.
Essentially, the RP provides guidance on two root cause methodologies: the fishbone diagram and 5 Whys. Though I’ve worked on trucks since 2004 and have been diagnosing them for about a decade, I had never heard of these tools before. Curious about how these could help me at the International dealership where I work, I set out to learn more.
My first step was getting a primer from Mike Parnitzke, owner/principal of Parnitzke Consulting Group. The former rocket scientist for Pratt Whitney is spearheading efforts to evolve the RP guidance from paper (or web viewer) into functional digital tools that could be used “in the garage and back office.” This will likely involve augmented reality and artificial intelligence and is a ways off. For now, I just wanted to use the basics to help me find the root cause of equipment failures and to make quality repairs to create lasting solutions.
So let’s start with the basics of RCA, which Parnitzke stressed “is not rocket science.” (And he would know.) It’s just the scientific method and asks the tech to define the problem, collect data to confirm root causes, and finally establish ways to eliminate them for good.
He explained it’s going from “Houston, we have a problem …” to “Houston, we have an understanding of the problem.”
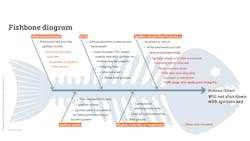
This begins with the fishbone diagram, created by Dr. Kaoru Ishikawa, a Japanese quality control expert, in the 1960s. It maps the real possibility of failure for various categories that branch off from the spine. When you are all done, it looks like a fish skeleton.
“The fishbone diagram is a brainstorming-centric tool and has several steps in it to help you focus and also organize your thoughts,” Parnitzke explained.
You start by creating the problem statement and quantify what is happening, not why. The RP uses the example of high maintenance expenses with wheel bolt hole cracking as a leading expenditure. If you don’t put enough information and thought into the head of your diagram, you’ll find yourself floundering later, so don’t rush.
Using technical manuals and other resources based on the categories, you then create general cause categories, such as processes, policies, people, equipment, and so on. Brainstorm the subcategories, such as “irregular tire wear” and “lack of proper lube” under equipment, and ask why each is happening. Then cull the root causes from these by determining if the “cause” is removed or corrected, then the issue stops. Validate with other subject-matter experts as a “sanity check.”
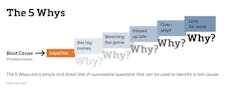
The next step is to look at the 5 Whys, a simple and direct line of successive questions that a team of SMEs can use to identify a root cause. It’s best used when there is before and after data/evidence for a problem. Once everyone is gathered, they must define the problem effect, and put it at the top of a flipchart or whiteboard. Keep asking why that happened and then what made that happen until your fifth “why” in the chain and the root cause is revealed. At each step, you likely have to discuss multiple possible pathways.
Read more: Don't distress; de-stress your diagnostic process
After discussing this with Parnitzke, I realized I do all of this informally in my head. I question the driver, review repair and warranty histories, read fault codes (and everything written about them), and use fault code trees when available. By using a process of elimination—my favorite is the FMI hierarchy—I narrow it down and finally identify the root cause.
The problem is that when I convert my diagnostic process from my head to paper, it becomes what I call “technician hieroglyphics.” I understand it, but others do not. At times, this causes friction when my service writer needs an answer key to decipher my personal language.
Although validating to know I’ve been intuitively using similar strategies to what TMC advises, I figured adding some tips from the RP to my diagnostic tool bag would help me find the root cause in a more focused way on paper.
Fortunately, I got my chance when a 2016 International ProStar with a problem rolled into the shop. The driver reported this truck just didn’t know when to quit; the engine and everything stayed on even when the key was turned off.
First, I verified the entire truck would stay live with the key in the “off” position and out of the ignition. The engine stayed running, the radio played, and the dash lit up with ABS traction control, trailer, and “electrical fault.”
It was time to utilize a fishbone diagram, I thought. This job did not have a diagnostic path written and no active codes to chase. All I had was a major symptom, which became my “effect.” Now, I needed to find the “root cause.”
As I was writing out the path, another diagnostic tech, Dave Caponigro, asked what I was doing.
My brief explanation had piqued his interest. (Lured him right in.) He even prompted his ChatGPT to make a fishbone diagram for my exact effect, but the AI bot could not do it. It was up to me, and it turned out to be exactly the type of job that reminds me why I am so passionate about what I do. Charting each major category branch, or bone, I was able to visualize what my next steps were going to be in testing and eliminating theories
After thinking about it, I decided the problem effect was: “Will not shut down with ignition key.” The major categories were: “aftermarket install,” “ignition switch,” “ECM,” “module component,” and “battery short to ignition.” After reviewing it with my service manager, Joe Dougherty, he added a few more subcategories, which were tested strategically as I moved down to the spine.
I verified the replaced key switch was not the cause of the problem and that the installed aftermarket devices did not come with any “creatively added” circuits. Those theories were eliminated.
Next, I pulled the ECM fuse from the panel. The engine shut down, but the electrical stayed on. I repeated the same procedure for the body and Bendix controllers, and after that pulled ignition fuses one at a time. Finally, when the F5-F aftertreatment fuse was pulled, everything shut off. This was my first theory but last branch in my fishbone, as the box is difficult to get to on this chassis at ground level.
I lifted the truck to access the several panels to reach the PDM. I peeled open the box, and there it was—filled with water and cyan-colored from the corrosion—exactly what I expected to find and the true root cause. I rebuilt the entire PDM with a new updated, sealed PDM and mounted it by reversing the clips and bolt heads on the top rather than bottom.
To ensure I could permanently fix the issue, I did a 5 Whys analysis asking how the PDM went bad. In the end, I determined that the box design led to the failure and that if I simply replaced it with a similar version, the problem would reoccur. So I used a better designed box that completely sealed except for 26 empty terminal slots.
The fishbone diagram was so helpful that I have used it on multiple jobs since then. I am certain I will use these tools in every complex diagnostic I get going forward. It kept me focused and organized while I was able to change my technician hieroglyphics into a legible story.
Now I just sit here with one more why. Why has this not been a part of my diagnosis all along?
About the Author
Missy Albin
Missy Albin has been recognized by International Trucks as “one of the best technicians in the network” and is the OEM’s Female Technician Ambassador for the Tech EmPowerment recruitment program. She began working on diesel trucks in 2004 and joined International in 2009 at an IC dealership. While pregnant in 2017, Albin continued to work in the shop and even earned her Master Truck Certification during that time.


